jBeats4zos – Kibana Dashboards Part 1
In this and further posts we will show how jBeats data is visualized in Kibana dashboards.
In this post, we are looking at common CPU system metrics. The dashboards shown here are based on data from SMF records type 70 and 72. The report includes Precalculated Metrics (e.g. CP and IIP Software MSU) provided automatically by jBeats.
In further articles in this series, we will present dashboards with reports that thematically focus on other aspects of the system and are based on other record types.
Essentially, all record types available in jBeats can be used to create dashboards. It is also straightforward to create your own dashboards!
A full list of all record types available for jBeats4zos can be found here.
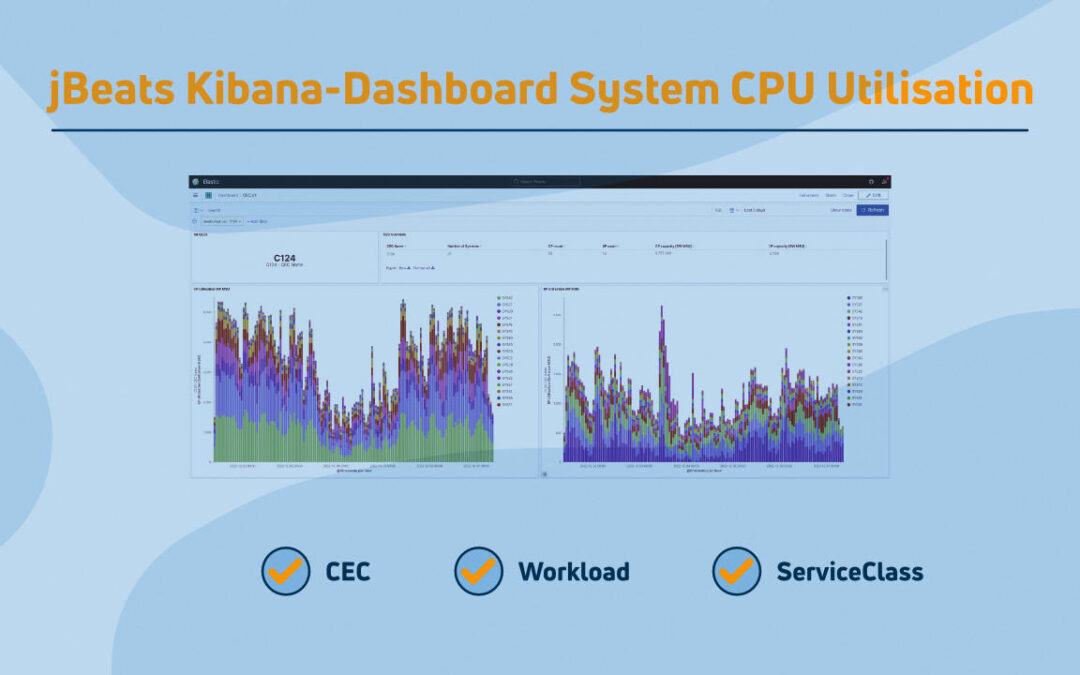
CEC-Total

The figure above contains a typical view of the company CECs.
On the top left is a listing of all CECs that provide data to jBeats. To the immediate right is an overview of available capacities grouped per CEC.
The bottom half of the dashboard shows usage graphs of the CECs based on system and processor types (CP, IIP) in software MSU.
The graphs show total utilization over the selected time period (6 days in the example) grouped by system.
Peaks within the selected time window can be seen immediately. The visualization includes the possibility of detailing the data by drilldown.
The CEC-View

The first step in analyzing a problem is to identify the CEC that shows anomalies.
Thus, the first drilldown step is the view of a single CEC.
The selection of the CEC is done by a simple click on the name in the upper left section of the overall view. In addition, it is also possible to change the time period for a first approximation.
Workloads

From the CEC view, you can jump to the workload view by clicking on the relevant system. The dashboard contains CPU usage data within the selected system in the chosen time period.
Again, the data is displayed as stacked bars to show both the overall view and the utilization of individual workloads.
The usage at workload level is based on the SMF record type 72.
Service classes

Starting from the workload view, you can drill down to the underlying service classes. Again, the view contains CPU utilization split according to the processor types involved at the service class level.
In this way, it is possible to identify which service classes use the processors particularly heavily and intervene if necessary to use resources more efficiently.
0 Comments